Smart Volume Analysis Group Trade Results for January (+2566): The myfxbook screenshot for the months trading results is included: http://goo.gl/7mh0US Contrary to what you may be thinking, this is not a fluke.
 EU Index Basket Trading Using Smart Volume Analysis (Click to open and follow along)
Basket Trading Using Smart Volume Spread Analysis
Smart Group Trade Entries on EU Index H4
Some recent trade setups using only catalyst signals with no warnings, or minor warnings are taken. These are four hour trades using our simple Four Step Method which you can find on our website (www.smartvsa.com).
Short Trades
1. Smart Volume Analysis Upthrust (Up Bar Upthrust Warning but taken based on other factors including location and VBS)
2. Smart Volume Analysis Upthrust (No Warning)
3. Smart Volume Analysis Upthrust (No Warning)
Long Trades
4. Smart Volume Analysis Smart Buying Signal (No Warning) as shown at right (6)
5. Smart Volume Analysis Reverse Upthrust (No Warning)
6. Current Trade Information Area which includes Smart Volume Analysis Trade Advisor Warnings if any.
7. Smart Volume Analysis Reverse Shakeout (No Warning) This trade was not taken but it was a very good one.
Other trade setups that were also catalysts had warnings I avoid. Generally location based warnings. If you know what’s possible with baskets you know how these trades went. People that don’t know simply wouldn’t believe it so I’ll just say this… The EURUSD component of a single basket was up over 90 pips on it’s own (There are 7-8 pairs generally in a group trade). This particular trade was taken live for our basic alert service. Please read the article about group trading on our website for some insights into this method with the critical puzzle piece… Our very powerful Volume Analysis Software and our proven methods.
We have a test account setup for development on Group Trading Tools that you can follow for free on twitter. Just ask for information in the ticket.
Thank you.
If you would like to receive more information regarding our signals, methods, and software, visit our website www.smartvsa.com
Usergroups:
- Smart Traders Official Google+ Community (Recommended): Smart Volume Spread Analysis Community on Google+
- Smart Traders Official Google+ Page: Smart Volume Spread Analysis Google+ Page
- Smart Traders Official Facebook Group (Closed To New Members – We’ve moved to Google+ – Link above): Smart Traders Official Facebook Group
- Smart Volume Analysis Blog: Smart Volume Analysis and Volume Spread Analysis Blog (News, Information, Trading Methods Etc.)
Miscellaneous Resources:
- Smart Volume Analysis Newsletter: Free Smart Volume Spread Analysis Newsletter (Free)
- Free Live Room (Usually Runs Each Day): http://goo.gl/2bKP9 (Check usergroups for start times)
- Smart Volume Spread Analysis VSA trade setup alert service Click here.
Contact and Support Links:
Smart Volume Analysis Four Step Method 2.0
Most visitors to our website are familiar with the Four Step Method. It was/is a huge game changer in terms of making our software very easy to master and profit from. Even though there are many ways to use and profit from Smart Volume Analysis and our software the Four Step Method is still widely used and for good reason however, one thing became apparent after the release of our Smart Trade Advisor… The VBS (Visual Background Scanner) step in the original method would tend to be a bit more restrictive than is necessary. The original version of this method was written before the creation of our Smart Trade Advisor Module which up until that point was a checklist of sorts in the client area. This new version of the popular method replaces the VBS step with an advisor warning check instead and is an excellent filter for most entries and it opens up many more trade possibilities without increasing risk. I will put some notes at the bottom as a guide to some other uses for the Advisor (2) and VBS (5) for trade selection.
I am trying to be as succinct as possible with the guidelines for this newer version of the method but if you have any questions please contact us at the support link above and I can help. This document will also reference a few links in the article as part of the process so let us know if you have any questions regarding those as well.
In this newer version of the Four Step Method there is only one significant change to be aware of. Instead of checking the VBS (5) for trade entry confirmation, we look to the Advisor (2) instead.
- Look and see if a trade signal has just appeared on our chart (1) (If no signal exists it will be clear from the Signal Information Text Area (Number 6 on the screenshot and in brackets) If a signal exists it’s name and meaning will appear in the signal information area (1)
- Check the advisor warning if any (2) If no warning exists, a trade can be opened in the direction of the signal’s meaning (Long for Strength and Short for Weakness)
- The signal’s EOM (3) is the target for this method. Typically the safe target is what you would select as your "Take Profit" level (23 pips in this example). Catalyst signals and those with or without warnings can change this (Refer to the notes below) Please also refer to the EOM document for information on how these level are derived.
- If the trade hits the target (EOM) it should be closed. If the trades goes for the full bar it should be closed at the end of the bar.
Screenshot of Smart Volume Analysis Four Step Method 2.0 Steps:
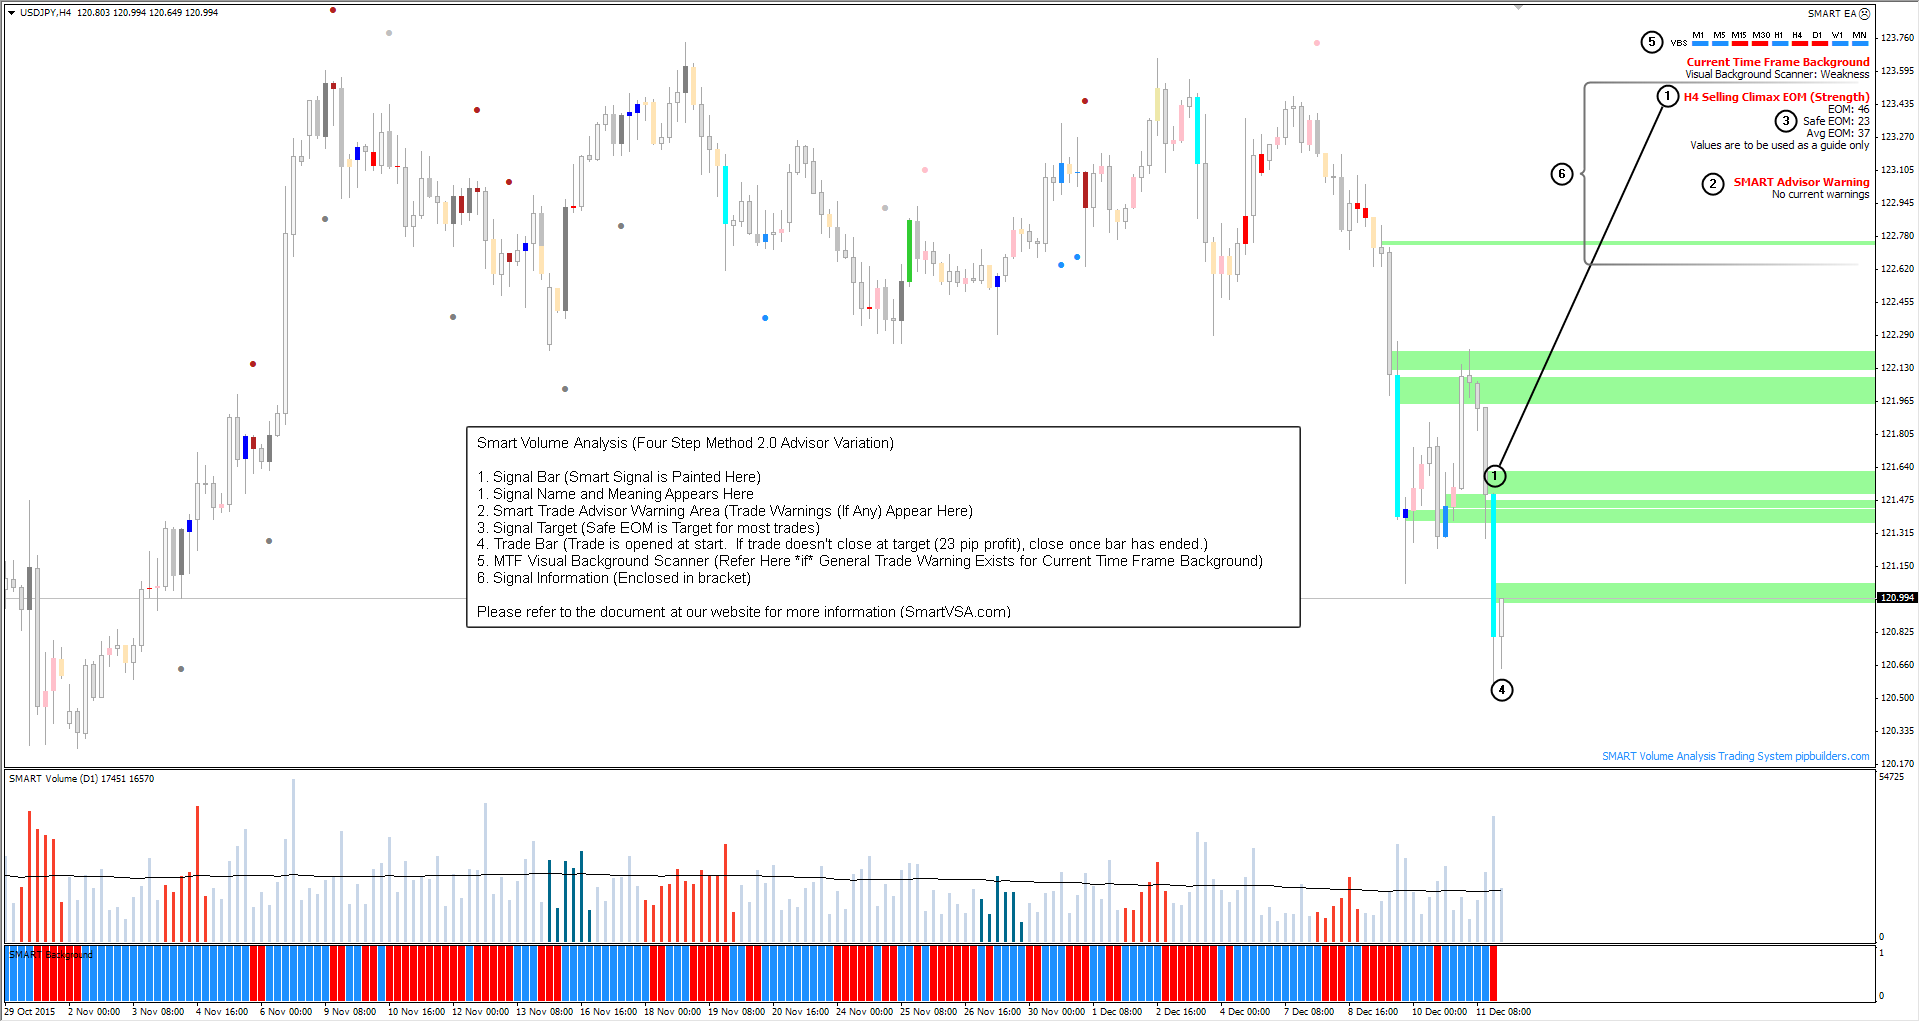
Screenshot Text:
Smart Volume Analysis (Four Step Method 2.0 Advisor Variation)
1. Signal Bar (Smart Signal is Painted Here)
1. Signal Name and Meaning Appears Here
2. Smart Trade Advisor Warning Area (Trade Warnings (If Any) Appear Here)
3. Signal Target (Safe EOM is Target for most trades)
4. Trade Bar (Trade is opened at start. If trade doesn’t close at target (23 pip profit), close once bar has ended.)
5. MTF Visual Background Scanner (Refer Here *if* General Trade Warning Exists for Current Time Frame Background)
6. Signal Information Area (Enclosed in bracket)
Notes:
- *If* the Smart Trade Advisor is showing a warning for the trade but not one we specifically avoid as per the advisor document in the client area, it makes sense to consult the VBS for the current time frame at that point for additional confirmation.
- A trade should always be closed after one bar for this method by design however, I sometimes wait to see what, if any signal appears on the next bar and will leave the trade open if a new trade with the above criteria presents itself. This is risky and should only be used by those with a fair amount of experience with Smart and Smart Volume Analysis
There are a number of methods you can use with Smart but the four step is one of the easiest to master which is why we use it as the introductory method to get started trading Smarter. As you gain more experience with Smart and Smart Volume Analysis, you can move on to other methods (such as the Smart Signal to Signal Method). Smart is a visual system and as such you will likely start to notice patterns and develop your own methods very quickly as well.
For more information or if you have any questions about SMART Volume Analysis (SVA) and Smart Volume Spread Analysis (VSA) the methods, or our Software (Smart Trader) please visit the following link: Smart Trader VSA (Volume Spread Analysis) Software
You can also visit our Live and Free VSA (Volume Spread Analysis) Chat, Trading Rooms, and our other free volume spread analysis resource sites (linked below) to learn more.
For information on our real time, volume based trading alerts, Click here.
Good luck trading and see you in the groups.
Usergroups:
- Smart Traders Official Google+ Community (Recommended): http://goo.gl/7X6UD
- Smart Traders Official Google+ Page: http://goo.gl/B0Eph
- Smart Traders Official Facebook Group (Closed To New Members – We’ve moved to Google+ – Link above): http://goo.gl/8vH1t
- Smart Volume Analysis Blog: http://goo.gl/wHdCU (News, Information, Trading Methods Etc.)
Miscellaneous Resources:
- Smart Volume Analysis Video Newletter: http://goo.gl/zoUDd
- Free Live Room (Usually Runs Each Day): http://goo.gl/2bKP9 (Check usergroups for start times)
Contact and Support Links:
 Learn how smart volume spread analysis techniques and methods can massively accelerate success and profits, all while minimizing the risks of basket trading (trading baskets) aka group trades
As many of you know, I trade baskets using Smart Volume Spread Analysis and our unique trading tools with extraordinary results. Trading groups more commonly known as Basket Trading using smart volume spread analysis is one of the greatest ways to trade and it’s actually very safe contrary to what many traders may think. Read on for some common misconceptions and mistakes people make when trading baskets and why smart volume spread analysis does away with any question in terms of entries and targets etc. This article may quite literally change your life. Many clients have asked for an article detailing how I basket trade using Smart but I procrastinate quite a bit when it comes to writing. I am not the greatest writer and tend to ramble on and qualify everything for those that don’t speak English as a first language. For these reasons, if you are unclear on anything presented here or have any questions at all please send a ticket using the support link. Even if you’re not a client, I answer every ticket personally and no matter how trivial your question may seem to you, ask anyway. I am here to help. Now, let’s get to it.
What is Basket Trading? Basket Trading, or as I call it, Group Trading is taking a position on multiple pairs/instruments at the same time to capitalize on weakness or strength in the underlying base currency or instrument. For example, if you think the USD is weak, you would short the USD by opening a "basket" of trades comprising the US Dollar major pairs such as short USD/JPY long GBP/USD etc. If you’re right it only takes a very small move on the USD to do very well on group trades. Unfortunately many traders first experience with basket trading is from one of the methods posted to various Forex and trading forums. I am sure many of you that have perused any of these forums have stumbled upon various basket trading threads. One in particular that comes up a lot when I chat with clients is T101. This was (and may still be) a very popular method for trading baskets but (unlike smart volume trading) most basket trading methods are very inconsistent as many of you may already know. The problem isn’t with the underlying concept of basket trading. The profit potential from trading groups of currencies as a single trade is an eye opener. The problem was due to the tools and methods used for entries. T101 for example uses "spaghetti" indicators among others to look at the relative strength or weakness of a particular group of currencies. The time it took for the indicator to signal a trade was usually so long that you would enter the wrong way when you finally got the green light from these lagging indicators. Occasionally you would get in a good trade and make a huge amount of pips in a very short amount of time. That’s the lure of basket trading but the reality for most basket traders using a method such as T101 is a lot of losses. That is the curse of lagging indicators. The concept of trading baskets was not new to me but it was obvious to me to use the one indicator that offers real-time information about the markets like no other… Volume. There is no better or easier way to trade baskets using volume successfully than with Smart Volume Spread Analysis.
How do you know if the price is weak or strong? We show over and over how Trade choice is made easier and safer by using "Catalyst Signals" and one or both of two very simple Smart Volume Analysis trading methods (The Four Step Method and The Signal To Signal Method) I have written about each of these and their results extensively here and in the client documentation area over the years. The only difference between what we normally discuss here is that you apply these techniques to a basket rather a single trade. It’s actually very simple. There are of course many ways to trade baskets using volume but these methods will offer a greater degree of safety and profit results unsurpassed in normal trading. As you get more comfortable with Smart and Trading Baskets it just gets easier.
The pip amounts when trading baskets correctly with the right tools, methods, and concepts can be substantial as shown by my own results using Smart Volume Analysis. Along with some simple concepts, and very powerful smart volume analysis tools included with our software (see below) you can quickly master this seemingly complicated trading strategy.
A single days result. If you’d like to see more just ask:
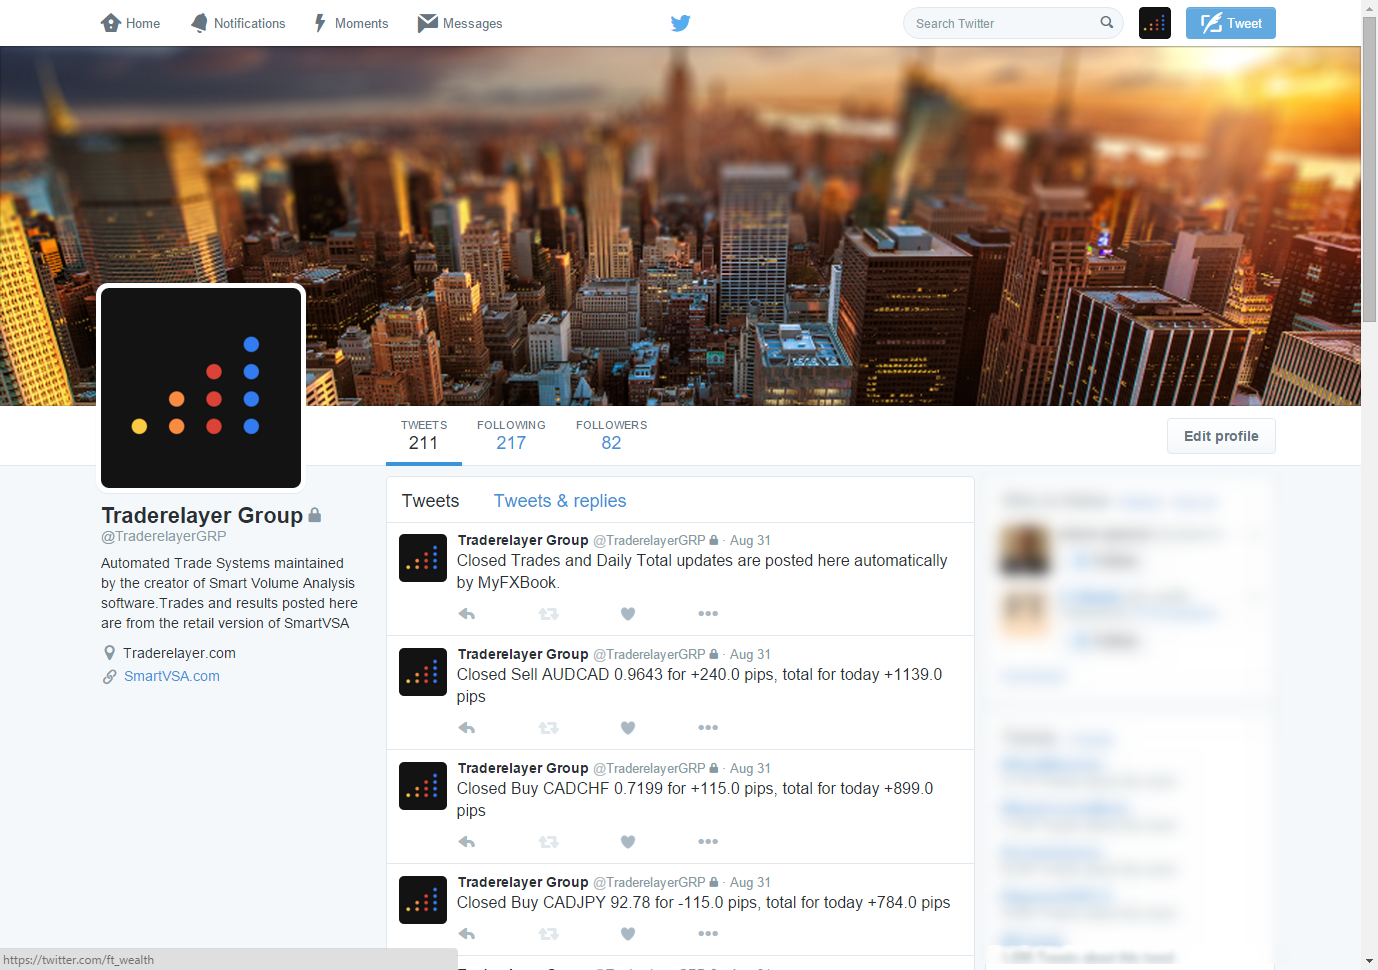
Yes these totals (1,139 pips) are daily totals The first screenshot shows the results for a a single day and was posted automatically by MyFXBook. The next screenshot is 1800+ pips and from a few days earlier. Both trades were made using the Smart Signal To Signal Method. When I tell people I get results like this trading baskets, they think it’s not possible or that it was just luck until I show them the screenshots or they follow along with the twitter account (See Resources Below). Some would argue that this was just a lucky trade or a single example. There is no such thing as luck. Winning trades done consistently may make it seem you are lucky but if you follow the twitter feed (Link below) you can see the results are very consistent day in and day out. It’s not luck and I hate when it’s diminished as such. It’s trading smart using Smart Volume Spread Analysis. When you understand the underlying 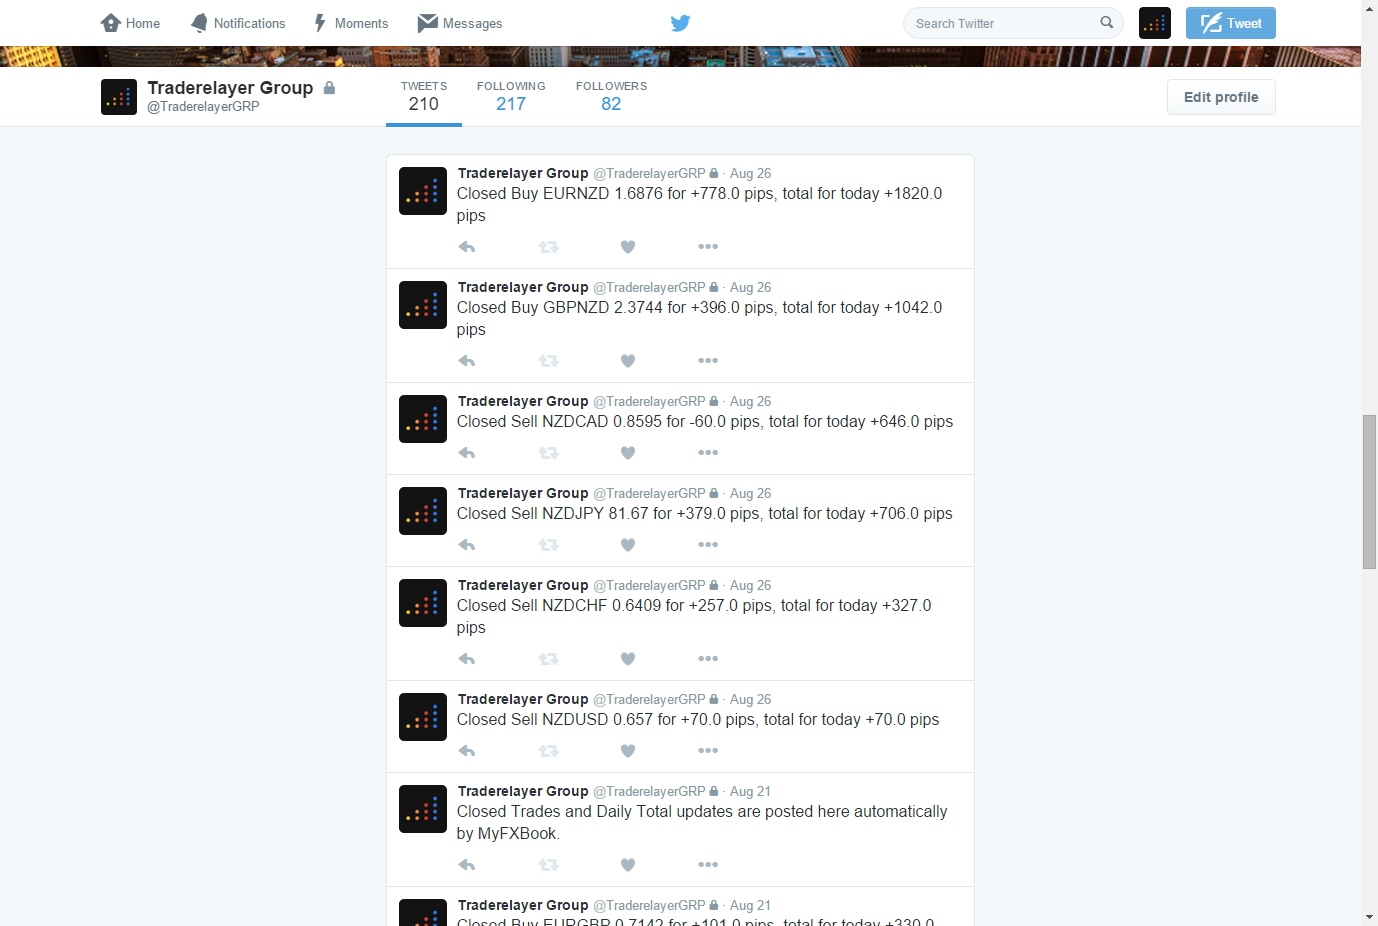 mechanics of basket trading and that it only takes a small move on each pair in the basket to make hundreds of pips (Sometimes within minutes) you realize not only is it possible but it’s easy too. How are such high amounts of pips possible? The easiest way to explain why 1000+ pips in a day isn’t that strange is to think about multipliers. A single trade on a currency pair that yields 30 pips is a good trade of course but that same trade with an average of 30 pips per pair in a basket of trades would yield hundreds of pips in the same amount of time. A couple of profitable basket trades like the example I posted here in a week and you can take the rest of the month off. Group trading follows very closely with my goal. Making more while trading less. How though do you know, when to enter a basket and more importantly, exit? Safety and risk is a very big concern when trading baskets because the moves can be quite large but when using Smart Volume Spread Analysis to trade you are way ahead of any other basket trading method. Let me explain why volume is the best way to trade groups and baskets. Smart Volume Spread Analysis signals trades just before large trend changes as well as big moves up and down throughout the day. This is extremely important for trading baskets. If you are right about the direction the basket will work out very well and this is much easier if you use the right methods and tools. Smart Trader Smart Volume Spread Analysis Software is exactly that.
Isn’t Basket Trading Risky? If done incorrectly… Yes. If done correctly you can cut the risk substantially. Using Smart Volume Analysis you have a number of very powerful benefits before even entering a trade such as knowing the direction the market is going to go short term, the EOM levels for the trade, Trade Warnings from our Smart Trade Advisor etc. One other important consideration is that the risk of the trade is spread out among a number of pairs, not a single trade that can either fail or succeed. If any one pair falls or rises due to news or similar the rest of the basket absorbs that risk and in many cases still be a great trade. For example. Let’s say you are long the EUR based off a catalyst signal. Shortly after entering there is news in Japan that causes the EURJPY to react against the trade. The other pairs in that basket would likely absorb the negative move in the EJ as the other pairs in the basket would be less affected by the news in Japan. This is better than taking a single position in the EURJPY which would result in a loss.
The results I achieve is thanks in large part to a few concepts I developed over the years as a direct result of the risks associated with trading baskets. Many of you will recognize the following terms from the chats, articles, and methods. Things like Catalyst signals. EOM (Expectation of Movement). Time based exits etc. Many of these very common methods/concepts came directly from my experience and needs using Smart Volume Analysis for basket trading.
One thing to try as you advance is alternative baskets using smart volume signals on multiple charts instead of a single base currency. You may already be doing this now without even realizing it.
We have many new features planned for future updates to Smart Trader specifically for basket trading such as index charts. volume based strength meters, chart weighting, basket EOM averaging, signal weighting and rankings for better trade choice, and much more. I use many of these concepts/methods manually already and can explain if you’d like in a chat so that you can start using them in the meantime.
Common Misconceptions When It Comes To Trading Baskets and How Smart Volume Can Help:
- More risk due to multiple positions
- Risk is actually limited and not increased when trading baskets correctly. See above.
- Wrong direction can kill account
- Smart Volume Analysis helps to always make sure you are in the right direction and "trading with the market" and not against it. Our EOM’s get you out at the ideal target.
- No usable targets
- Our Smart EOM Targets help tremendously.
Why Use Smart Volume Analysis To Trade Baskets?
- No Lagging Indicators Associated With Trade Entry and Exit Signals/Indicators
- Unique Volume Based Basket Opportunities Unavailable To Anyone Else
- Know The Likely Direction of Market with Near 100% Accuracy
- Simple and Easy to Identify Entry Signals
- Simple and Easy to Identify Exit signals
- Make very large amounts of pips very quickly with only small underlying price moves
Resources:
- The Four Step Method Documentation (Available in the client documentation website)
- The Signal To Signal Documentation (Available Soon in the client documentation website)
- Basket Trading Entry, Exit, And Management Scripts Freely Available to Smart Clients (Submit a Ticket)
- Free Consultation and tips etc available to Smart Clients (Submit a Ticket To Schedule a Chat)
- See The Complete Results of My Basket Trading (Follow @TraderelayerGRP on Twitter)
- This is the account the screenshot posted above is is unedited and posted by MyFXBook directly, not me. It’s an older account I used to test automated basket trading systems I use personally and for Advanced alerts on Traderelayer.
If you are an existing client you likely already know and use many of the concepts detailed here for your trading and can quickly use them to trade baskets. I can help if you need it, just ask. If you do not yet own Smart please check out our order page for a special offer to get started trading smart at a discount. We very rarely discount Smart so act quickly. Also both the Four Step Method and the Signal To Signal method are available again as automated trading systems. These are only available for a limited number and time. Check the order page for more information.
If you have any questions about basket trading using volume or any questions at all please send a ticket using the support link on our website (www.smartvsa.com)
As many of you know from previous articles on our site, the Smart Upthrust is one of my favorite signals. Rightfully so as this "catalyst signal" is consistently one of the more profitable trade setups using Smart Volume Analysis. As good as this signal is there are times it fails. Experience has shown us when they are likely to fail with near 100% accuracy. It is these observations that led to the creation of one our unrivaled and most important modules, the Smart Trade Advisor. This particular module is very powerful and is akin to having a full time Volume expert trading along side you at all times.
Take a look at the following example of a Smart upthrust on the EURUSD four hour chart.

The signal appears at a near term top after a fairly large move up. Normally this is a great spot to go short. When this signal appears on your chart in this area is normally a turning point in the market and typically precedes a large move down. However, there was a warning on the trade that is almost always a reason to stay out. In the example the Smart Trade Advisor saved you from a very large mistake (-66 pips range on the "trade bar")
More articles and information on our software is available at our website. SmartVSA.com
If you have any questions feel free to contact us using the support link on our website.
 Smart Volume Analysis Software – Catalyst Signals For Quick EOM Trades
If you’ve read any of the articles about Smart Volume Analysis you know I normally suggest taking quick Catalyst trades to our one bar EOM Targets as shown in the screenshot to the right however, the aim of this article is to show just how easily you can consistently trade larger moves with just a few simple steps. This article was inspired by a recurring conversation I have with many traders on trend trading. Enjoy.
Why is Trend Trading Like Chasing Ghosts?
I hear a lot of people say I trade trends. Trend trading is one of the most damaging myths in the trading world. I liken it to "Chasing Ghosts" The trend is your friend? Yeah… Sure it is. That quote gets bandied about a bit but the problem is most people don’t usually hear the full quote. The complete quote is ‘The trend is your friend… until it ends.’ It paints a different picture when you hear the end of the quote included doesn’t it?
It’s not that trend trading is a bad thing or that you will always fail but rather that trends are very difficult to trade correctly and consistently and stay profitable over the long haul. Unfortunately many traders lose a lot of their capital trying to catch these waves and eventually give up in disgust.
Trying to catch a trend? You are chasing ghosts and you will likely lose a lot of money while you hunt.
How could you possibly know when a trend is ending? Many times traders enter long on a nice up move and get creamed in short order. They scream "but the trend was up!" Don’t get me wrong, trends (large moves up or down on longer time frames) do exist and are great trades when you get in them however they are notoriously hard to identify and trade correctly. Even with so-called trend trading software and tools you will likely fail more than you should.
The trend may be your friend but Smart will always invite you to the best parties.
So what is the secret to successful trend trading? How can you know when the trend is going to end? If you could figure that out you’d be very wealthy and probably wouldn’t need this article…
It is not only possible, it’s very easy to get in early on a large move in price and ride it all the way to the next major reversal and take it back the other way. We prove it again and again in our articles and it’s actually very easy to do. When you trade using Smart Volume Analysis, you can clearly see where these large moves start and turn around. They are often preceded by what I call Catalyst Signals. All signals are clearly marked on the chart and when a catalyst signal appears, we know that the start of a large price move is about to begin. We can enter the trade with confidence and ride the complete move, then exit safely on the next catalyst signal and if conditions are right, take the trade in the opposite direction for another large move the other way. You can do this day in and day out. Take a look at the following screenshot. I marked the longer moves and noted the signals that preceded them. Do you see the repeating patterns? Each of the colored bars on the chart is a Smart Volume Spread Analysis signal but a few are a very special brand of signal that we call catalyst signals. These are the signals you want to trade… When you see them set up in real-time, you are always in a prime position to consistently get in, and stay in these larger price moves.
 Easy and Profitable Trend Trading Prowess Using Smart Volume Spread Analysis Catalyst Signals
Text from screenshot:
This is how simple Volume Based Trend Trading can be: Long Term Catalyst Trades (Signal To Signal Validated by Trade Advisor)
Occasionally you get a great exit and reversal signal at the same time but usually you get out shortly before the reversal. I noted the exit signals if exited before the next entry signal. To be clear… We are only taking Catalyst Signals with Trade Advisor Validation. This should be clear to anyone that uses Smart and Trades the Catalyst Signals but for those that don’t I have marked whether the trade is taken to the next signal or if exited at a Reverse Catalyst Signal.
- 1 to 2. 546 Pips
- 2 to 3. 879 Pips
- 3 (Exit at RUT). 1012 Pips
- 4 to 5. 1071 Pips
- 5 (Exit at SS). 694 Pips
- 6 (Exit at SB Warning). 149 Pips (Only trade with DD for more than one bar)
- 7 to 8. 317 Pips
- 8 (Exit at RSO). 155 Pips
- 9 (Exit at RUT). 916 Pips
- 10 to 11. 1536 Pips
- 11 to ?. 406 Pips (? Trade is still open)
Total pips from all trades is an astounding 7,681 Pips From Only One Chart
It should be noted… Trade Catalyst Signals work on any time frame and any market. I used this chart specifically to illustrate how safely trades can be taken for longer term moves providing you enter on a Catalyst with the Smart Trade Advisor validation. It couldn’t be easier because everything you need appears on your chart in real time.
More articles and information on our software is available at our website. SmartVSA.com
Stop chasing ghosts and start trading Smart.
As many of you know from the live trading and chat rooms I can be a bit of a goofball but the post title of this article above is no joke…
Unlike our competition (if you can even call them that) we do not need to charge you for mentoring, seminars, boot camps, books, useless add on's, or any other nonsense. We sell a full suite of Proprietary Volume Analysis Modules in one simple package and you'll never have to pay for upgrades, lease for multiple payments, or pay for new signal modules, concept modules, or updates. Our goal is to help you make money not for you to help us make money. We will not scam or spam you into buying software that does not work only to charge you more money to "learn" it. As complex as our software behind the scenes we can show you how to trade it in 3 steps using very simple rules. Our EOM concept profit targets using our proprietary Signals and Smart Background Modules (VBS) are hit 90%+ across the board. Some are even higher. For those looking for more robust information this is but one way to use our software, there are more and we detail them for free in our live video room daily.
While our software and the concepts that make it work so well are extremely complex and complicated, the rules for trading the software are not. Look at the screenshot below to see one very easy (and profitable) method to trade Smart.
Don't just take our word for it. Come into any of our FREE resource sites and see what real users are saying. Now onto the examples and screenshot.
These examples are not cherry picked, the screenshots included in this article are real World examples selected from all of the charts I watch where the signal(s) and or concepts being discussed appeared at the time this article was written.
If you have any questions please refer to the links at the bottom of this article.
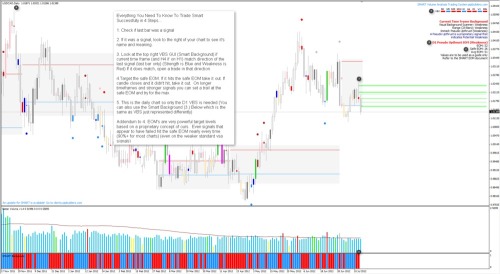
[screenshot]

[text from screenshot]
Everything You Need To Know To Trade Smart Successfully in 4 Steps…
1. Check if last bar was a signal
2. If it was a signal, look to the right of your chart to see it's name and meaning.
3. Look at the top right VBS GUI (Smart Background) if current time frame (and H4 if on H1) match direction of the last signal (last bar only) (Strength is Blue and Weakness is Red) If it does match, open a trade in that direction.
4.Target the safe EOM. If it hits the safe EOM take it out. If candle closes and it didn't hit, take it out. On longer timeframes and stronger signals you can set a trail at the safe EOM and try for the max
5. This is the daily chart so only the D1 VBS is needed (You can also use the Smart Background (3.) Below which is the same as VBS just represented differently)
Addendum to 4. EOM's are very powerful target levels based on a proprietary concept of ours. Even signals that appear to have failed hit the safe EOM nearly every time (90%+ for most charts) (even on the weaker standard vsa signals)
It really is this simple. For those looking for more robust information this is but one way to use our software, there are more and we detail them all for free in our live video room daily.
Each VSA signal and indication within our software has it's own color. SMART Trader itself is painting these colors which makes these patterns and setups much easier to see and act on. Using Smart VSA you can profit from these examples day in, and day out. There is no guesswork. If a signal is shown, it is valid. It really is that simple.
Trade setups are verified using our Proprietary Smart Visual Background Modules and Proprietary Smart EOM Concept Module which are included with the system.
For more information or if you have any questions about SMART Volume Spread Analysis (VSA) and our Software please visit the following link
Smart Trader VSA (Volume Spread Analysis) Software you can also visit our Live and Free VSA (Volume Spread Analysis) Chat, Trading Rooms, and our other free volume spread analysis resource sites (linked below) to learn more.
For information on our real time, volume based trading alerts, Click here.
Good luck trading and see you in the chat (Links below).
Live Volume Spread Analysis (VSA) Trading Rooms, Chat, and Seminars:
- Free Smart Volume Spread Analysis (VSA) Live Seminars: http://eepurl.com/lkdzn
- Free Volume Spread Analysis Trading Room (Text Chat) Open 24 Hours but can be very slow as many have transitioned to our social network sites: http://vsa.pipbuilders.com
- Free Volume Spread Analysis Trading Room (Video Screensharing) Open Periodically (See Social Networking Sites Below For Times): http://live.smartvsa.com
- Real Time, Volume Based Trading Alerts on Emini, Forex, and More: http://www.traderelayer.com (Free Two Week Trial)
Volume Spread Analysis (VSA) Social Networking Sites:
- Smart Trader's Facebook Group (Requires Approval) General Volume Trading Group: https://www.facebook.com/groups/smarttraders/
- Smart Trader's Google+ Page (Open) Creators of Smart VSA: http://goo.gl/nzRa0
- Smart VSA Twitter Feed (Open) Creators of Smart VSA: http://www.twitter.com/pipbuilders
If you have any questions regarding Smart VSA or our software please visit our website (http://www.smartvsa.com) and submit a ticket using the support or contact link.
Thanks and see you in the chat.
As many of you know we have released Smart Volume Analysis 2.0 Unofficially Last Night (Message on your chart) – You may have noticed one major change… We changed the name of our product. We did this because we wanted to distance ourselves somewhat from standard VSA. It doesn't really work without massive tweaks and our proprietary concepts and many clients think the association is hurting us and we agree. Smart Volume Analysis is way beyond the scope of the standard and less reliable Volume Spread Analysis so a name change was warranted.
The version number was also a big jump. We changed to 2.0 (rather than 1.0.6) This is a huge update and reflects better where we are now in the development cycle.
SMART Volume Analysis v2.0 Release Notes:
Noteworthy Changes Since Last Update:
- Changed Product Name From SMART Trader to SMART Volume Analysis
- Optimized Upthrust and Reverse Upthrust Modules (Pseudo Versions As Well)
- Optimized Absorption Volume Module
- Optimized Range Background Scanner
- Fixed Bug Within The SOW Module (Obsoleted As Well By The New Pattern Validation Module (Smart Visual Background Scanner)
- Added Proprietary No Buying Interest Module And Custom Alert
- Changed all indicators to default sounds off within the included templates
- Optimized Global Settings
- Fixed Issue With Gaps And Some Modules
- Optimized And Added Additional Signal Condition To Banger Module
- Added VBS to MTF Background GUI/MTF BG Scanner Modules.
- Optimized Climactic Bar Conditions For EOM and Pattern Validation Module
- Fixed Background Scanners Issue Related To Climactic Weak/Strong Bars.
- Added Our Proprietary EOM (Expectation Of Movement) Concept Module
- Optimized Conditional Settings For Smart Buying and Smart Selling Modules.
New Modules:
- Unconfirmed No buying Interest Module
- No Buying Interest Module (Confirming Signal)
- Proprietary Smart Visual Background Scanner/Visual Background (VBS/VB)
- Two Finger Salute (Advanced Module)
- Fosters Flop (Advanced Module)
- Proprietary Smart Zones Module
- Proprietary EOM Concept Module
New files:
- SMART Framework Module EOM
- SMART Advanced Signal Module Fosters Flop
- SMART Advanced Signal Module Two Finger Salute
- SMART Signal Module Climactic Bar Strong
- SMART Signal Module Climactic Bar Weak
- SMART Signal Module No Buying Interest
- SMART Signal Module UC No Buying Interest
- SMART Visual Background
- SMART Visual Background MTF
- SMART VBS – iCustom
- SMART VBS
- SMART Zones – Debug (admin only)
- SMART Zones – iCustom
- SMART Zones MTF
- SMART Zones
- SMART Debug Range (admin only)
- SMART Debug Volume (admin only)
We will be running the live room over the next few days (linked below) to help with any issues or questions you may have. The lead developer will also be available to answer any technical questions.
For more information or if you have any questions about SMART Volume Spread Analysis (VSA) and our Software please visit the following link
Smart Trader VSA (Volume Spread Analysis) Software you can also visit our Live and Free VSA (Volume Spread Analysis) Chat, Trading Rooms, and our other free volume spread analysis resource sites (linked below) to learn more.
For information on our real time, volume based trading alerts, Click here.
Good luck trading and see you in the chat (Links below).
Live Volume Spread Analysis (VSA) Trading Rooms, Chat, and Seminars:
- Free Smart Volume Spread Analysis (VSA) Live Seminars: http://eepurl.com/lkdzn
- Free Volume Spread Analysis Trading Room (Text Chat) Open 24 Hours but can be very slow as many have transitioned to our social network sites: http://vsa.pipbuilders.com
- Free Volume Spread Analysis Trading Room (Video Screensharing) Open Periodically (See Social Networking Sites Below For Times): http://live.smartvsa.com
- Real Time, Volume Based Trading Alerts on Emini, Forex, and More: http://www.traderelayer.com (Free Two Week Trial)
Volume Spread Analysis (VSA) Social Networking Sites:
- Smart Trader's Facebook Group (Requires Approval) General Volume Trading Group: https://www.facebook.com/groups/smarttraders/
- Smart Trader's Google+ Page (Open) Creators of Smart VSA: http://goo.gl/nzRa0
- Smart VSA Twitter Feed (Open) Creators of Smart VSA: http://www.twitter.com/pipbuilders
If you have any questions regarding Smart VSA or our software please visit our website (http://www.smartvsa.com) and submit a ticket using the support or contact link.
Thanks and see you in the chat.
Learn how to avoid this nonsense…
June 1st (Breaking News Alert): Wall Street suffered its bloodiest day of the year as U.S. stocks sank more than 2% following an ugly jobs report. The Dow erased all its gains for the year, dropping more than 270 points for the day.
Today (Breaking News Alert): The Dow and S&P posted their best day of 2012 as investors grew hopeful that more stimulus for the global economy is around the corner. The Dow gained 284 points.
Trade Smart.
For more information or if you have any questions about SMART Volume Spread Analysis (VSA) and our Software please visit the following link
Smart Trader VSA (Volume Spread Analysis) Software you can also visit our Live and Free VSA (Volume Spread Analysis) Chat, Trading Rooms, and our other free volume spread analysis resource sites (linked below) to learn more.
For information on our real time, volume based trading alerts, Click here.
Good luck trading and see you in the chat (Links below).
Live Volume Spread Analysis (VSA) Trading Rooms, Chat, and Seminars:
- Free Smart Volume Spread Analysis (VSA) Live Seminars: http://eepurl.com/lkdzn
- Free Volume Spread Analysis Trading Room (Text Chat) Open 24 Hours but can be very slow as many have transitioned to our social network sites: http://vsa.pipbuilders.com
- Free Volume Spread Analysis Trading Room (Video Screensharing) Open Periodically (See Social Networking Sites Below For Times): http://live.smartvsa.com
- Real Time, Volume Based Trading Alerts on Emini, Forex, and More: http://www.traderelayer.com (Free Two Week Trial)
Volume Spread Analysis (VSA) Social Networking Sites:
- Smart Trader's Facebook Group (Requires Approval) General Volume Trading Group: https://www.facebook.com/groups/smarttraders/
- Smart Trader's Google+ Page (Open) Creators of Smart VSA: http://goo.gl/nzRa0
- Smart VSA Twitter Feed (Open) Creators of Smart VSA: http://www.twitter.com/pipbuilders
If you have any questions regarding Smart VSA or our software please visit our website (http://www.smartvsa.com) and submit a ticket using the support or contact link.
Thanks and see you in the chat.
We are live again at Join Me. http://live.smartvsa.com/
We are demonstrating new signal and framework modules for the next update including some of our proprietary concept modules (EOM, SZ, and Visual Background etc.)
No installation or registration is required to join. We will discuss Volume Spread Analysis on Live charts using Smart VSA (for more information on Smart Volume Spread Analysis and how effective it is visit: http://goo.gl/DnBlL)
The code for today's room (for those using a mobile app) is: 353-212-064
If you get an error saying the meeting is closed or the code is invalid, it simply means the meeting is done for the day.
Here are some links to our our free resources. As always if you have any questions please contact us via our support link on our website.
Live Volume Spread Analysis (VSA) Trading Rooms, Chat, and Seminars:
- Free Smart Volume Spread Analysis (VSA) Live Seminars: http://eepurl.com/lkdzn
- Free Volume Spread Analysis Trading Room (Video Screensharing) Open Periodically (See Social Networking Sites Below For Times): http://live.smartvsa.com
- Real Time, Volume Based Trading Alerts on Emini, Forex, and More: http://www.traderelayer.com (Free Two Week Trial)
- Trade setups and explanations: http://pipbuilders.posterous.com
Volume Spread Analysis (VSA) Social Networking Sites:
- Smart Trader's Facebook Group (Requires Approval) General Volume Trading Group: https://www.facebook.com/groups/smarttraders/
- Smart Trader's Google+ Page (Open) Creators of Smart VSA: http://goo.gl/nzRa0
- Smart VSA Twitter Feed (Open) Creators of Smart VSA: http://www.twitter.com/pipbuilders
If you have any questions regarding Smart VSA or our software please visit our website (http://www.smartvsa.com) and submit a ticket using the support or contact link.
Thanks and see you in the chat.
